Another title for this post: What It Is That Scientists Do at Those Meetings, Anyway?
Last winter, in the midst of a deep freeze, and up to my neck in class work, I came across an announcement for a meeting on South American climate change. Specifically, the focus of the conference was climate change and human interactions with climate over the last 2000 years (for more info see Lotred-SA Symposium). I had explicitly stated in my sabbatical proposal that I would attend a conference focusing on my new research direction in order to meet people and get a feel for what type of work is going on in the field. This was perfect. It combined my interest in pursuing research on South American climate change, with my experience studying paleoclimate. The meeting was in Medellín, Colombia – some place warm and tropical, and not far from where I will stay during my Fulbright (after all, Ecuador is just across the border) – the perfect sabbatical kick-off.
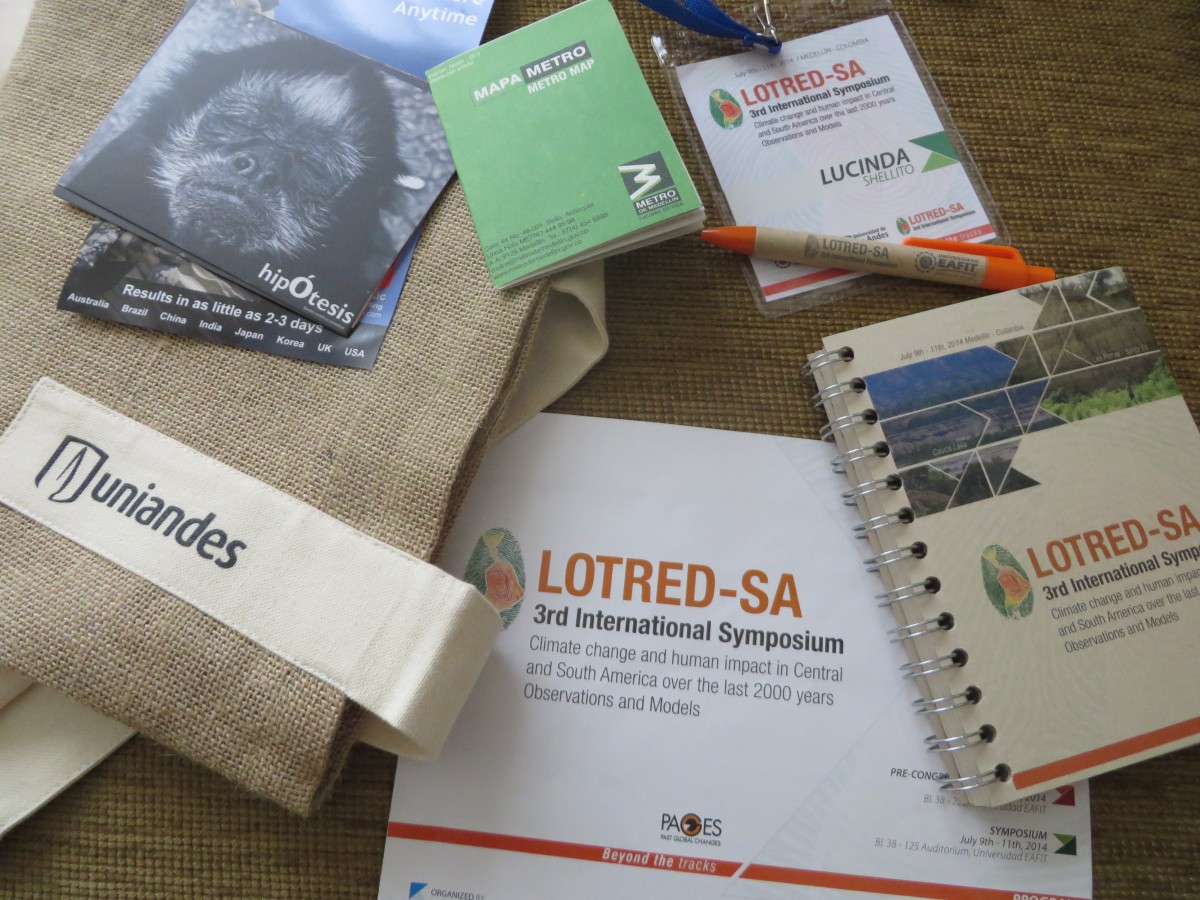
Conference SWAG was particularly colorful for this meeting. I especially loved the spiral-bound abstract volume that would fit easily into any bag.
Colombia is a new hotspot for paleoclimate research, as it turns out, with teams of people at universities in Bogota and Medellin working to decipher tropical climate change. (It’s becoming a hotspot for European tourists as well – and the occasional North American – but that’s another story!)
This particular meeting was small – maybe 120 participants – and that was part of the appeal. Often, scientific meetings are held in big convention centers and can attract tens of thousands of people. Small meetings, particularly those in intriguing places, make it much easier to get to know people. Scientific meetings, conferences, conventions, all serve the purpose of letting people share their latest work, and to get feedback and ideas for continuing their work to see it come to fruition in the form of a publication. The ‘sharing’ usually occurs via one of two methods: talks, or posters. The talks are generally 15-20 minutes, with some exceptions for invited guests, and involve someone whipping through a series of Powerpoint slides. This method of presentation allows for high visibility – as you might expect, when you attend a conference of 120 people – but very little time for interaction immediately after the talk. Of course, there are always coffee breaks – but often, it’s hard to remember your questions by the break. At major conventions (American Geophysical Union, American Meteorological Society, Geological Society of America), there are many, many concurrent sessions, with synchronous talks, and you can often find individuals running back and forth from one room to the next to try to catch one person in one session, and another talk in another room immediately afterward. Small meetings have the advantage that EVERYONE is seeing everyone else’s talk.
The other method of presentation is ‘the poster’. You prepare a summary of your work on a large poster – usually 4’ x 5’ or so – post it up in a hallway or large room with a lot of other posters, then, at designated times, you stand by your poster and wait for interested people to walk by. Disadvantage: LOW visibility. You do as much as you can to make your poster visually appealing, so that people will want to stop and look at it. You may also end up presenting your work 10 times in the course of an hour to 10 different people – in which case, there’s lots of interaction.
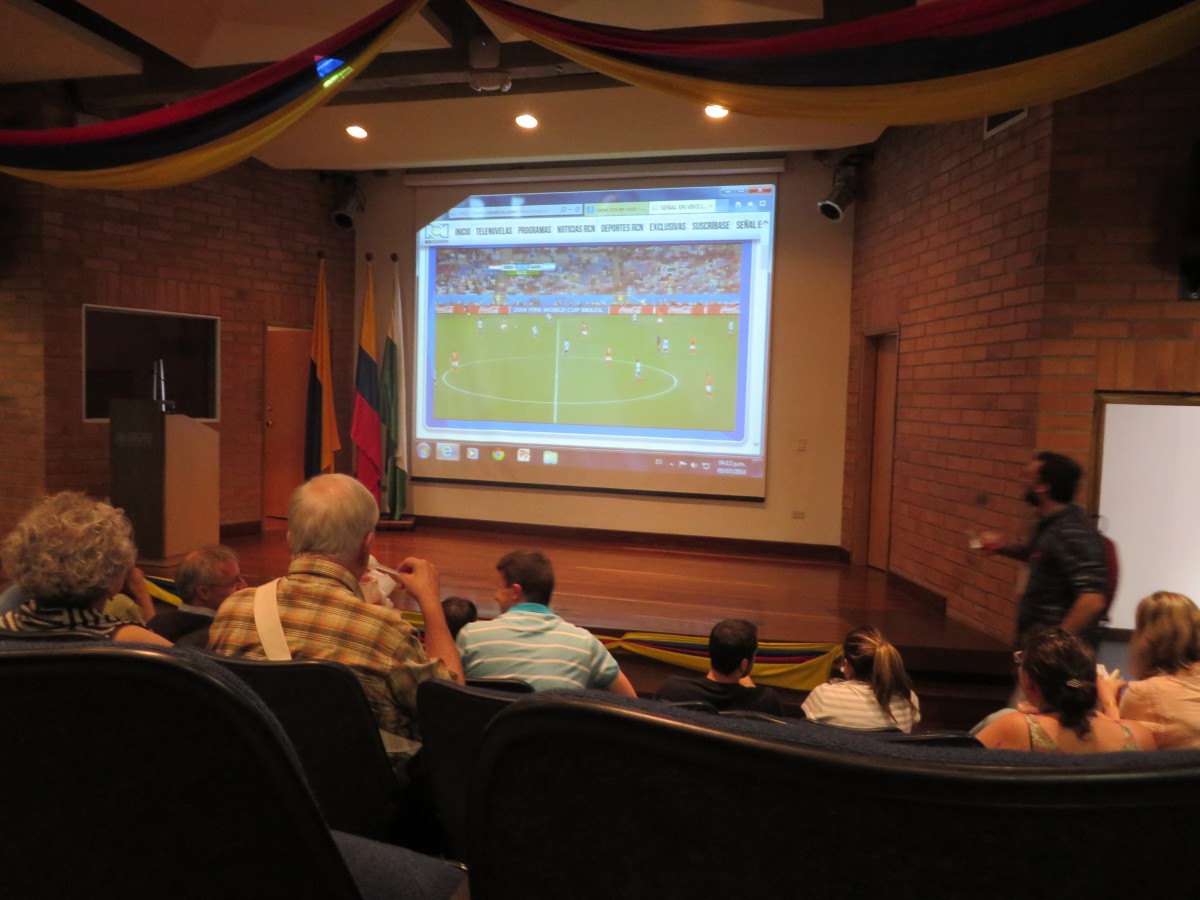
At small science meetings, presentations might be interrupted on occasion by international events (the World Cup)
I presented in neither form at this conference. My goal was to absorb as much as I could about current work in South and Central America, and meet and talk to as many interesting people as possible to help me formulate a long-term research plan (beyond the sabbatical). This meeting was focused on efforts to reconstruct the climate of South America over the past 2000 years, and so, more than 90% of the talks and posters featured interpretations of climate proxies (i.e., inferences of climate from geologic or environmental record) at particular localities. A few of the introductory talks, and talks associated with climate models make attempts to put all of our information together to understand atmospheric circulation and large scale climate patterns in South America.
Here’s the key: understanding how the climate of South America has evolved over the past 2000 years, particularly understanding how seasonal and annual changes in the atmosphere, such as those connected to Intertropical Convergence Zone (aka – ITCZ – rainy region over the Equator – or, near it, anyway), the South American Summer Monsoon (SASM – brings moisture to the southern Amazon), the El Niño – Southern Oscillation (ENSO), and other phenomena change over time, can provide us insight regarding their responses to climate change in the present, and in the future. Changes in the ITCZ, SASM, and ENSO, have huge implications for changes in rainfall patterns – which means big impacts on water resources. The interactions between these circulation patterns is something I’m very interested in, as a climate dynamicist (someone who studies the physics of climate). I’m also particularly interested in how they affect precipitation in the high Andes. (Here’s why).
Overall, it’s an amazing thing that we can gather so much information about past and present climate. The only way we can do this is with a global community.
A few really interesting tidbits about South America and about climate that I learned in the meeting:
- As the Amazon is being cleared, people are discovering ‘geoglyphs’ – which suggests that this is not the first time people have had an impact on this area (check out this NYT article)
- ENSO, ITCZ, and SASM movements affect different regions in South America very differently. Most people are somewhat familiar with El Niño. During El Niño, the waters off the west coast of South America warm up. This makes the coastal areas much wetter than normal. What people aren’t aware of is that not far away, in the high Andes, there can be periods of drought during El Niño. The effects vary considerably from one place to another, and we still don’t fully understand how.
- Low-level jets, atmospheric rivers and atmospheric lakes, and their influence on climate variability are big topics right now. Never heard of an atmospheric lake? It’s basically a new way of describing regions of the atmosphere with high water vapor. You might think of atmospheric rivers as jets that transport large quantities of water vapor from the tropics to the mid-latitudes. If you’ve heard of the ‘Pineapple Express’ – that, on occasion, dumps rain on the West Coast of the US – this is one of those ‘rivers.’ The concept is essentially changing the paradigm on how we think about atmospheric circulation and what drives that circulation. (For a little more, you can view the NOAA Atmospheric River Information Page) As of this posting date, there is no information page for ‘atmospheric lakes.’
There’s lots more, but hopefully enough for the science geeks who managed to reach the end of this post!
